


Informatics Educational Institutions & Programs


Size of this preview: 800 × 434 pixels. Other resolutions: 320 × 173 pixels | 640 × 347 pixels | 1,024 × 555 pixels | 1,450 × 786 pixels.
Original file (1,450 × 786 pixels, file size: 458 KB, MIME type: image/png)
Summary
| Description |
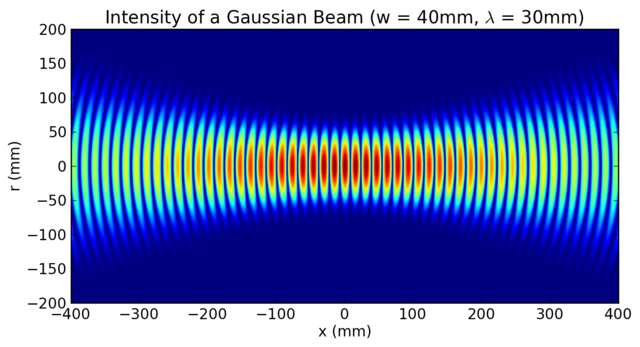
English: This is a plot of the instantaneous intensity of a Gaussian beam as a function of r and x.
Author: Eric Toombs Source: computer rendering via matplotlibThis plot was created with Matplotlib. |
| Date | 25 July 2011 (original upload date) |
| Source | Transferred from en.wikipedia by Ronhjones |
| Author | Etoombs at en.wikipedia |

|
This image is an information graphic created by a computer program from data sets or formulas that have not been fully provided on this page. In order to allow other editors to improve or build such images, and to ensure compliance with free content licenses such as the GFDL, the following should be provided:
|
|
| |
Licensing
Etoombs at en.wikipedia, the copyright holder of this work, hereby publishes it under the following license:
This file is licensed under the Creative Commons Attribution 3.0 Unported license.
Attribution: Etoombs at en.wikipedia
- You are free:
- to share – to copy, distribute and transmit the work
- to remix – to adapt the work
- Under the following conditions:
- attribution – You must give appropriate credit, provide a link to the license, and indicate if changes were made. You may do so in any reasonable manner, but not in any way that suggests the licensor endorses you or your use.
Original upload log
The original description page was here. All following user names refer to en.wikipedia.
Upload date | User | Bytes | Dimensions | Comment
- 2011-07-25 07:20 (UTC) | Etoombs | 469446 (bytes) | 1450×786 | Sign error. Just compare the two images yourself to see what I changed.
- 2011-07-25 06:52 (UTC) | Etoombs | 437214 (bytes) | 1420×662 | This is a plot of the instantaneous intensity of a Gaussian beam as a function of r and z. Author: Eric Toombs Source: computer rendering via matplotlib
File history
Click on a date/time to view the file as it appeared at that time.
| Date/Time | Thumbnail | Dimensions | User | Comment | |
|---|---|---|---|---|---|
| current | 23:43, 13 January 2012 | | 1,450 × 786 (458 KB) | Ronhjones | (Original text) : Sign error. Just compare the two images yourself to see what I changed. |
| 23:43, 13 January 2012 |  | 1,420 × 662 (427 KB) | Ronhjones | (Original text) : This is a plot of the instantaneous intensity of a Gaussian beam as a function of r and z. Author: Eric Toombs Source: computer rendering via matplotlib |
File usage
The following pages on the English Wikipedia use this file (pages on other projects are not listed):
Global file usage
The following other wikis use this file:
- Usage on ca.wikipedia.org
- Usage on es.wikipedia.org
- Usage on fa.wikipedia.org
- Usage on fr.wikipedia.org
- Usage on ja.wikipedia.org
- Usage on sl.wikipedia.org
- Usage on zh.wikipedia.org
