


Informatics Educational Institutions & Programs

Size of this preview: 800 × 516 pixels. Other resolutions: 320 × 206 pixels | 640 × 412 pixels | 928 × 598 pixels.
Original file (928 × 598 pixels, file size: 24 KB, MIME type: image/png)
Summary

|
This file may be updated to reflect new information. If you wish to use a specific version of the file without new updates being mirrored, please upload the required version as a separate file. |
| Description |
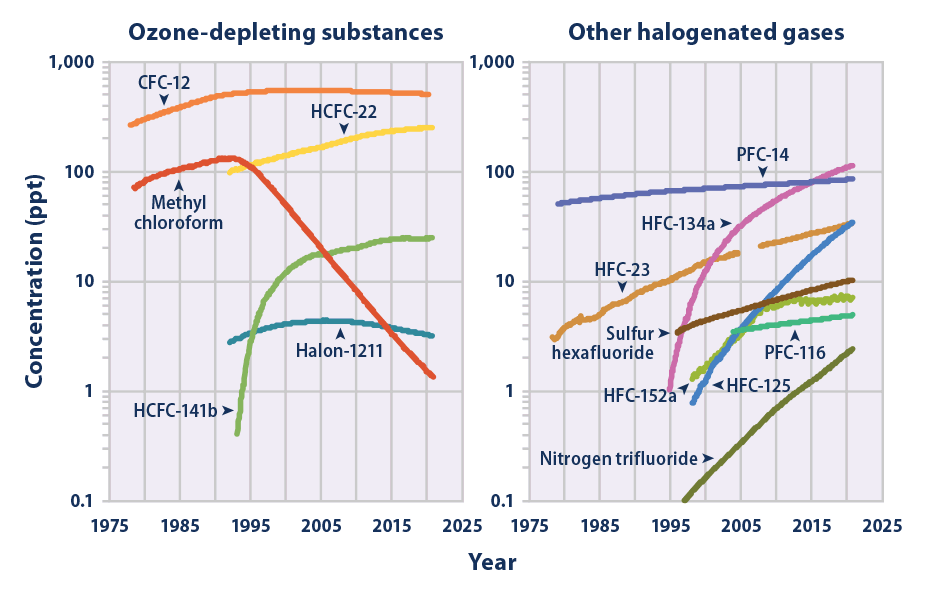
English: The two graphs show global changes in the concentration (measured in parts per trillion, or ppt) of several important halogenated gases in Earth's atmosphere. The data were collected from sites around the world between years 1978 and 2021. The left graph shows gases which cause substantial ozone depletion, as well as atmospheric heating. The right graph shows gases whose main impact is global warming.
All of the gases are human-made and manufactured in industrial amounts starting as early as the mid-twentieth century. Severe depletion of Earth's protective ozone layer inspired efforts to reduce the production of some gases starting the late 1980s. Overall, the manufacture of most other gases is still rapidly increasing, as indicated by the logarithmic scale used to graph the concentrations. Data Sources/References:
|
| Date | |
| Source | https://www.epa.gov/climate-indicators/climate-change-indicators-atmospheric-concentrations-greenhouse-gases |
| Author | United States Environmental Protection Agency - Unauthored |
Licensing
This image is in the public domain because it contains materials that originally came from the U.S. National Oceanic and Atmospheric Administration, taken or made as part of an employee's official duties.
|
File history
Click on a date/time to view the file as it appeared at that time.
| Date/Time | Thumbnail | Dimensions | User | Comment | |
|---|---|---|---|---|---|
| current | 06:37, 29 August 2022 | | 928 × 598 (24 KB) | A876 | updated by author to cover 1978-2021. |
| 00:03, 15 April 2022 |  | 928 × 598 (24 KB) | A876 | compacted. octree from RGB (3348 colors) (no noticeable change) to 256 colors. zopfli png compression (lossless). | |
| 23:49, 14 April 2022 |  | 928 × 598 (74 KB) | A876 | updated by author to cover 1978-2018. (includes ALL of the previous version (1978-2015), so REPLACING it is no loss.) | |
| 17:05, 25 September 2020 |  | 928 × 598 (77 KB) | Bikesrcool | Uploaded a work by United States Environmental Protection Agency - Unauthored from https://www.epa.gov/climate-indicators/climate-change-indicators-atmospheric-concentrations-greenhouse-gases with UploadWizard |
File usage
The following pages on the English Wikipedia use this file (pages on other projects are not listed):
Global file usage
The following other wikis use this file:
- Usage on bn.wikipedia.org
- Usage on es.wikipedia.org
- Usage on fr.wikipedia.org
- Usage on it.wikipedia.org
- Usage on zh.wikipedia.org
