


Informatics Educational Institutions & Programs

Orthogonal_Matching_Pursuit.gif (576 × 189 pixels, file size: 1,003 KB, MIME type: image/gif, looped, 96 frames)
Summary
| Description |
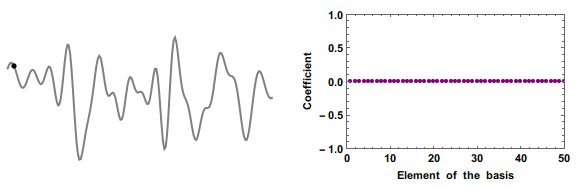
English: Retrieving an unknown signal (gray line) from a small number of measurements (black dots) is in general impossible.
But if you know that the signal can be represented with only a few nonzero elements of a basis, then you can use "compressed sensing". By making the measurement in a basis that is incoherent with the basis the signal is sparse in, you ensure each measurement sample as many coefficients as possible. Here showing a "orthogonal-matching-pursuit" algorithm. The starting guess is that all coefficient are zero. At each iteration we add one coefficient that is nonzero, choosing the one that will effect our error metric the most. The value of those few nonzero coefficients are then estimated by a least-square fitting, and the process is iterated until the error is smaller than a given threshold. |
| Date | |
| Source | https://twitter.com/j_bertolotti/status/1214918749838594048 |
| Author | Jacopo Bertolotti |
| Permission (Reusing this file) |
https://twitter.com/j_bertolotti/status/1030470604418428929 |
Mathematica 11.0 code
(*Step 1: Generate the function to be retrieved and the "measurement matrix"*)
dim = 200; (*Number of points in the original data (input)*)
nm = 30; (*Number of measurements done*)
hf[n_, x_] := (E^(-(x^2/2)) HermiteH[n, x])/Sqrt[n! 2^n Sqrt[\[Pi]]]; (*Hermite polynomials*)
nb = 6; (*number of nonzero coefficients*)
nzc = Sort@RandomSample[Range[40], nb] (*non zero coefficients*)
c = RandomReal[{-0.8, 0.8}, nb]; (*coeffieicents*)
g = Sum[c[[j]] hf[nzc[[j]], z], {j, 1, nb}]; (*function we would like to retrieve (sparse in the Hermite polynomial basis by construction)*)
xideal = Normal@SparseArray[nzc -> c, {dim}]; (*ideal x vector we would like to retrieve*)
df = Table[g // N, {z, -7, 7, 14/(dim - 1)}];
m = Sort@RandomSample[Range[dim], nm]; (*Points where we make the measurements (in the canonical basis)*)
Atmp = SparseArray[Table[{j, m[[j]]}, {j, 1, nm}] -> Table[1, {j, 1, nm}] , {nm, dim}]; (*measurement matrix*)
\[CapitalPhi] = Table[N@hf[n, x], {n, 1, dim}, {x, -7, 7, 14/(dim - 1)}];(*matrix of change of basis from Hermite to canonical (rows are the hermite polynomials)*)
A = Atmp.Transpose[\[CapitalPhi]];
y = A.xideal;

(*Step 2: A working (but not optimized) implementation of the Orthogonal Matching Pursuit algorithm*)
(*initialization*)
\[Epsilon]0 = 10^-10; (*error threshold*)
x = Table[0, {dim}]; (*first guess for the coefficients is that they are all zero*)
r = y; (*so the residuals are identical to the measurements*)
nS = Range[dim]; (*the complement of the support is everything*)

\[Epsilon] = Table[Norm[A[[All, j]].r/Norm[A[[All, j]] ]^2 A[[All, j]] - r]^2, {j, 1, dim}][[nS]]; (*calculate the error for all columns of A that are not already in the support*)
j = Position[\[Epsilon], Min[\[Epsilon]]][[1, 1]]; (*select the one with the biggest impact on the error*)
\[Epsilon] = \[Epsilon][[j]]; (*that one is the new error*)
nS = Drop[nS, {j}]; (*update the complement of the support*)
S = DeleteCases[Range[dim], Alternatives @@ nS]; (*and thus update the support*)
AS = A[[All, S]];
x[[S]] = Inverse[Transpose[AS].AS].Transpose[AS].y; (*find the best fit for the new estimate of x (least square fit)*)
r = y - A.x; (*update the residuals*)
tmp = x;

evo = Reap[While[\[Epsilon] > \[Epsilon]0, (*repeat until the error is small enough*)
      \[Epsilon] = Table[Norm[A[[All, j]].r/Norm[A[[All, j]] ]^2 A[[All, j]] - r]^2, {j, 1, dim}][[nS]];
      j = Position[\[Epsilon], Min[\[Epsilon]]][[1, 1]];
      \[Epsilon] = \[Epsilon][[j]];
      nS = Drop[nS, {j}];
      S = DeleteCases[Range[dim], Alternatives @@ nS];
      AS = A[[All, S]];
      x[[S]] = Inverse[Transpose[AS].AS].Transpose[AS].y;
      r = y - A.x;
      Sow[x];
      ];][[2, 1]];
evo = Prepend[evo, tmp];

(*Step 3: Generate the animation*)
p0 = Table[GraphicsRow[{
     Show[
      ListPlot[df, Joined -> True, PlotStyle -> {Thick, Gray}, Axes -> False, PlotRange -> {-1, 1}, Epilog -> {PointSize[0.02], Point[({m, y} // Transpose)[[1 ;; k]] ]}] ]
     ,
     ListPlot[Table[0, {50}], PlotRange -> {{0, 50}, {-1, 1}}, Filling -> Axis, PlotStyle -> {Purple, PointSize[0.02]}, Axes -> False, Frame -> True, FrameLabel -> {"Element of the basis", "Coefficient"},
      LabelStyle -> {Bold, Black}]
     }, ImageSize -> Large]
   , {k, 1, nm}];
p1 = Table[
   GraphicsRow[{
     Show[
      ListPlot[df, Joined -> True, PlotStyle -> {Thick, Gray}, PlotRange -> {-1, 1}], ListPlot[(1 - \[Tau])*0 + \[Tau] Transpose[\[CapitalPhi]].evo[[1]], Joined -> True, PlotStyle -> {Thick, Orange}]
      , Axes -> False, PlotRange -> {-1, 1}, Epilog -> {PointSize[0.02], Point[{m, y} // Transpose]}
      ]
     ,
     ListPlot[\[Tau] evo[[1]], PlotRange -> {{0, 50}, {-1, 1}}, Filling -> Axis, PlotStyle -> {Purple, PointSize[0.02]}, Axes -> False, Frame -> True, FrameLabel -> {"Element of the basis", "Coefficient"},
      LabelStyle -> {Bold, Black}]
     }, ImageSize -> Large]
   , {\[Tau], 0, 1, 0.1}];
p2 = Table[Table[
    GraphicsRow[{
      Show[
       ListPlot[df, Joined -> True, PlotStyle -> {Thick, Gray}, PlotRange -> {-1, 1}], ListPlot[(1 - \[Tau])*Transpose[\[CapitalPhi]].evo[[k - 1]] + \[Tau] Transpose[\[CapitalPhi]].evo[[k]],
        Joined -> True, PlotStyle -> {Thick, Orange}]
       , Axes -> False, PlotRange -> {-1, 1}, Epilog -> {PointSize[0.02], Point[{m, y} // Transpose]}
       ]
      ,
      ListPlot[(1 - \[Tau]) evo[[k - 1]] + \[Tau] evo[[k]], PlotRange -> {{0, 50}, {-1, 1}}, Filling -> Axis, PlotStyle -> {Purple, PointSize[0.02]}, Axes -> False, Frame -> True,
       FrameLabel -> {"Element of the basis", "Coefficient"}, LabelStyle -> {Bold, Black}]
      }, ImageSize -> Large]
    , {\[Tau], 0, 1, 0.1}], {k, 2, Dimensions[S][[1]] - 1}];
ListAnimate[Flatten[Join[p0, p1, p2]]]
Licensing
| This file is made available under the Creative Commons CC0 1.0 Universal Public Domain Dedication. | |
| The person who associated a work with this deed has dedicated the work to the public domain by waiving all of their rights to the work worldwide under copyright law, including all related and neighboring rights, to the extent allowed by law. You can copy, modify, distribute and perform the work, even for commercial purposes, all without asking permission.
|
File history
Click on a date/time to view the file as it appeared at that time.
| Date/Time | Thumbnail | Dimensions | User | Comment | |
|---|---|---|---|---|---|
| current | 09:24, 9 January 2020 | 576 × 189 (1,003 KB) | Berto | User created page with UploadWizard |
File usage
Global file usage
The following other wikis use this file:
- Usage on ca.wikipedia.org
