


Informatics Educational Institutions & Programs

No higher resolution available.
Phenotypic_Phase_Plane_for_M.tb,_on_Glycerol_and_Glucose.png (352 × 283 pixels, file size: 44 KB, MIME type: image/png)
Summary
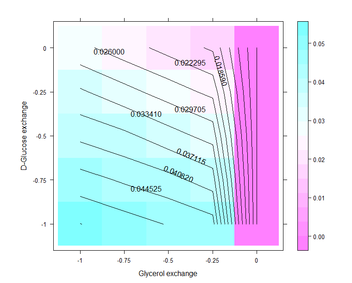
| Description | A heatmap-like plot (levelplot from lattice package in R) of the Flux balance analysis predicted growth rate of Mycobacterium tuberculosis on varying fluxes of glucose and glycerol. |
|---|---|
| Author or copyright owner |
Abhilash Gangadharan |
| Source (WP:NFCC#4) | Created it with my package abcdeFBA. Specifically the function PHPP. |
| Date of publication | 07-01-2013 |
| Use in article (WP:NFCC#7) | Flux balance analysis |
| Purpose of use in article (WP:NFCC#8) | To support encyclopedic discussion of this work in this article. The illustration is specifically needed to support the following point(s): Utility of PhPP in finding optimal growth rate on different media composition for M.tuberculosis |
| Not replaceable with free media because (WP:NFCC#1) |
n.a. |
| Minimal use (WP:NFCC#3) | it will just be used to describe Phenotypic Phase plane analysis in the context of Flux Balance Analysis therefore it won't be relevant to any other article |
| Respect for commercial opportunities (WP:NFCC#2) |
n.a. |
| Other information | |
| Fair useFair use of copyrighted material in the context of Flux balance analysis//en.wikipedia.org/wiki/File:Phenotypic_Phase_Plane_for_M.tb,_on_Glycerol_and_Glucose.pngtrue | |
Licensing
File history
Click on a date/time to view the file as it appeared at that time.
| Date/Time | Thumbnail | Dimensions | User | Comment | |
|---|---|---|---|---|---|
| current | 20:04, 15 February 2017 | | 352 × 283 (44 KB) | DatBot (talk | contribs) | Reduce size of non-free image (BOT - disable) |
| 19:45, 8 January 2013 | No thumbnail | 760 × 613 (29 KB) | Abhi asus 1987 (talk | contribs) | Uploading a non-free work, as object of commentary using File Upload Wizard |
You cannot overwrite this file.
File usage
The following pages on the English Wikipedia use this file (pages on other projects are not listed):
