


Informatics Educational Institutions & Programs


Size of this PNG preview of this SVG file: 300 × 300 pixels. Other resolutions: 240 × 240 pixels | 480 × 480 pixels | 768 × 768 pixels | 1,024 × 1,024 pixels | 2,048 × 2,048 pixels.
Original file (SVG file, nominally 300 × 300 pixels, file size: 807 bytes)
Summary
| Description |
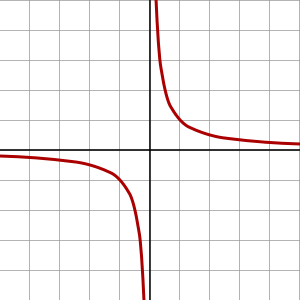
English: A plot of the graph of the rectangular hyperbola y = 1/x, with -5 <= x <= 5, -5 <= y <= 5 |
| Date | |
| Source | Own work |
| Author | Qef |
| Other versions | Bitmap graph of same function with same axes: Image:HyperbolaRect01.png |
This 0639 was created with a text editor by Krishnavedala.

Previous version had been created with Gnuplot (12625 bytes) now 6.39% of previous size
Please do not replace the simplified code of this file with a version created with Inkscape or any other vector graphics editor
Source code
Created using gnuplot with the following input file:
set terminal svg font "Bitstream Vera Sans,12" size 600,600
set output "Rectangular_hyperbola.svg"
set xrange [-8:8]
set yrange [-8:8]
set xzeroaxis linetype -1
set yzeroaxis linetype -1
set xtics axis nomirror offset 0,0.3
set ytics axis nomirror offset -0.8
set key off
set border 0
set samples 500
plot 1/x with line linetype rgbcolor "red" linewidth 2
The output SVG was filtered with this command to change the hyphens to proper minus signs:
sed -i 's/<text>-/<text>\xE2\x88\x92/g' Rectangular_hyperbola.svg
Licensing
| This work has been released into the public domain by its author, Qef. This applies worldwide. In some countries this may not be legally possible; if so: |
File history
Click on a date/time to view the file as it appeared at that time.
| Date/Time | Thumbnail | Dimensions | User | Comment | |
|---|---|---|---|---|---|
| current | 22:50, 8 January 2015 | | 300 × 300 (807 bytes) | Krishnavedala | domain changed to -5<=x<=5 |
| 22:40, 8 January 2015 |  | 640 × 640 (909 bytes) | Krishnavedala | simplified drawing and consistent with other polynomial plots | |
| 07:02, 2 July 2008 |  | 600 × 600 (12 KB) | Qef | {{Information |Description={{en|1=A plot of the graph of the rectangular hyperbola y = 1/x, with -8 <= x <= 8, -8 <= y <= 8.}} |Source=Own work by uploader |Author=Qef |Date=2008-07-02 |Permission= |other_versions=Bitmap graph of same functio |
File usage
The following pages on the English Wikipedia use this file (pages on other projects are not listed):
Global file usage
The following other wikis use this file:
- Usage on ca.wikipedia.org
- Usage on cy.wikipedia.org
- Usage on da.wikipedia.org
- Usage on de.wikipedia.org
- Usage on de.wikiversity.org
- Kurs:Algebraische Kurven (Osnabrück 2008)/Vorlesung 1
- Ebene affine Kurven/Hyperbel/zur Einführung/Beispiel
- Kurs:Algebraische Kurven (Osnabrück 2012)/Vorlesung 1
- Kurs:Grundkurs Mathematik (Osnabrück 2016-2017)/Teil I/Arbeitsblatt 25
- Kurs:Grundkurs Mathematik (Osnabrück 2016-2017)/Teil I/Arbeitsblatt 25/kontrolle
- Kurs:Algebraische Kurven (Osnabrück 2017-2018)/Vorlesung 1
- Kurs:Algebraische Kurven (Osnabrück 2017-2018)/Arbeitsblatt 4
- Kurs:Algebraische Kurven (Osnabrück 2017-2018)/Vorlesung 1/kontrolle
- Kurs:Algebraische Kurven (Osnabrück 2017-2018)/Arbeitsblatt 4/kontrolle
- Reelle Hyperbel/Irreduzible Komponenten/Aufgabe
- Kurs:Grundkurs Mathematik (Osnabrück 2018-2019)/Teil I/Vorlesung 25
- Kurs:Grundkurs Mathematik (Osnabrück 2018-2019)/Teil I/Arbeitsblatt 25
- Kurs:Grundkurs Mathematik (Osnabrück 2018-2019)/Teil I/Vorlesung 25/kontrolle
- Kurs:Grundkurs Mathematik (Osnabrück 2018-2019)/Teil I/Arbeitsblatt 25/kontrolle
- Invertierte Potenzfunktionen/Antiproportionaler Zusammenhang/Textabschnitt
- Kurs:Singularitätentheorie (Osnabrück 2019)/Vorlesung 5
- Kurs:Singularitätentheorie (Osnabrück 2019)/Arbeitsblatt 2
- Kurs:Singularitätentheorie (Osnabrück 2019)/Vorlesung 5/kontrolle
- Kurs:Singularitätentheorie (Osnabrück 2019)/Arbeitsblatt 2/kontrolle
- Singularitäten/Binomiale Gleichungen/Einführung/Textabschnitt
- Binomiale Funktion/Allgemeine Hyperbel/Beispiel
- Algebraische Kurven/Einführung/Gallerie/Erläuterung/Textabschnitt
- Kurs:Grundkurs Mathematik (Osnabrück 2022-2023)/Teil I/Vorlesung 25
- Kurs:Grundkurs Mathematik (Osnabrück 2022-2023)/Teil I/Arbeitsblatt 25
- Kurs:Grundkurs Mathematik (Osnabrück 2022-2023)/Teil I/Vorlesung 25/kontrolle
- Kurs:Grundkurs Mathematik (Osnabrück 2022-2023)/Teil I/Arbeitsblatt 25/kontrolle
- Usage on el.wikipedia.org
- Usage on es.wikipedia.org
- Usage on fi.wikipedia.org
- Usage on gl.wikipedia.org
- Usage on he.wikipedia.org
- Usage on he.wikibooks.org
- Usage on hi.wikipedia.org
- Usage on it.wikipedia.org
- Usage on ja.wikipedia.org
- Usage on ja.wikibooks.org
- Usage on mk.wikipedia.org
- Usage on ro.wikipedia.org
- Usage on sq.wikipedia.org
- Usage on ta.wikipedia.org
View more global usage of this file.
