


Informatics Educational Institutions & Programs


Size of this PNG preview of this SVG file: 400 × 600 pixels. Other resolutions: 160 × 240 pixels | 320 × 480 pixels | 512 × 768 pixels | 682 × 1,024 pixels | 1,365 × 2,048 pixels.
Original file (SVG file, nominally 512 × 768 pixels, file size: 5 KB)
Summary
| Description |
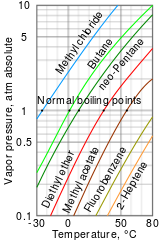
English: Log-lin chart of vapor pressure vs temperature for various liquids based on File:Vapor_Pressure_Chart.png . |
| Date | |
| Source |
This file was derived from: Vapor Pressure Chart.png |
| Author | cmglee, mbeychok |
| Other versions |
 |
Licensing
This file is licensed under the Creative Commons Attribution-Share Alike 3.0 Unported license.
- You are free:
- to share – to copy, distribute and transmit the work
- to remix – to adapt the work
- Under the following conditions:
- attribution – You must give appropriate credit, provide a link to the license, and indicate if changes were made. You may do so in any reasonable manner, but not in any way that suggests the licensor endorses you or your use.
- share alike – If you remix, transform, or build upon the material, you must distribute your contributions under the same or compatible license as the original.
File history
Click on a date/time to view the file as it appeared at that time.
| Date/Time | Thumbnail | Dimensions | User | Comment | |
|---|---|---|---|---|---|
| current | 22:38, 28 December 2015 | | 512 × 768 (5 KB) | Cmglee | User created page with UploadWizard |
File usage
The following pages on the English Wikipedia use this file (pages on other projects are not listed):
Global file usage
The following other wikis use this file:
- Usage on bn.wikipedia.org
- Usage on ca.wikipedia.org
- Usage on es.wikipedia.org
- Usage on hu.wikipedia.org
- Usage on id.wikipedia.org
- Usage on it.wikipedia.org
- Usage on ko.wikipedia.org
- Usage on sr.wikipedia.org
- Usage on sv.wikipedia.org
- Usage on ta.wikipedia.org
- Usage on te.wikipedia.org
- Usage on tr.wikipedia.org
- Usage on zh.wikipedia.org
