


Informatics Educational Institutions & Programs

No higher resolution available.
Xsection2.png (354 × 332 pixels, file size: 15 KB, MIME type: image/png)

|
This graph image could be re-created using vector graphics as an SVG file. This has several advantages; see Commons:Media for cleanup for more information. If an SVG form of this image is available, please upload it and afterwards replace this template with
{{vector version available|new image name}}.
It is recommended to name the SVG file “Xsection2.svg”—then the template Vector version available (or Vva) does not need the new image name parameter. |
Summary
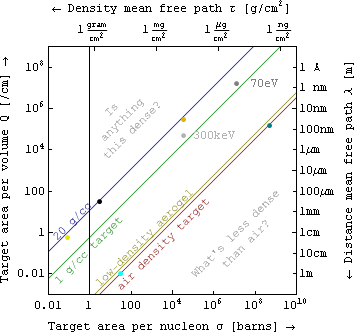
| Description | This figure plots equivalent quantities used in the theory of scattering from composite specimens, but with a variety of units, onto a single plot. The grey dots are for inelastic scattering of a 300 keV electron passing through a specimen of solid Silicon, as well as for an electron near its most strongly interacting energy of around 70 eV in a metal. The gold dot shows how a 300 keV electron has a shorter distance mean free path but about the same area cross-section. The mean free path between collisions of nitrogen molecules in air at STP is shown by the darker blue-green dot, while the cyan dot shows approximately where the mean free path for light scattering by fog might plot. The black and yellow dots denote nuclear cross-sections, e.g. in the latter case for Rutherford backscattering of a He nucleus from a gold foil. |
| Date | |
| Source | Own work |
| Author | P. Fraundorf |
Licensing
I, the copyright holder of this work, hereby publish it under the following licenses:

|
Permission is granted to copy, distribute and/or modify this document under the terms of the GNU Free Documentation License, Version 1.2 or any later version published by the Free Software Foundation; with no Invariant Sections, no Front-Cover Texts, and no Back-Cover Texts. A copy of the license is included in the section entitled GNU Free Documentation License. |
This file is licensed under the Creative Commons Attribution-Share Alike 4.0 International, 3.0 Unported, 2.5 Generic, 2.0 Generic and 1.0 Generic license.
- You are free:
- to share – to copy, distribute and transmit the work
- to remix – to adapt the work
- Under the following conditions:
- attribution – You must give appropriate credit, provide a link to the license, and indicate if changes were made. You may do so in any reasonable manner, but not in any way that suggests the licensor endorses you or your use.
- share alike – If you remix, transform, or build upon the material, you must distribute your contributions under the same or compatible license as the original.
You may select the license of your choice.
File history
Click on a date/time to view the file as it appeared at that time.
| Date/Time | Thumbnail | Dimensions | User | Comment | |
|---|---|---|---|---|---|
| current | 16:12, 27 February 2008 | | 354 × 332 (15 KB) | Papa November | rm opaque bg & cropped with GIMP. No copyright claimed for non-creative derivative work |
| 15:57, 27 February 2008 |  | 360 × 336 (15 KB) | Unitsphere | ||
| 15:42, 27 February 2008 |  | 283 × 264 (7 KB) | Papa November | Cropped and rm opaque background using GIMP. No copyright claimed for non-creative derivative work | |
| 15:07, 27 February 2008 |  | 288 × 288 (7 KB) | Unitsphere | {{Information |Description=This figure plots equivalent quantities used in the theory of scattering from composite specimens, but with a variety of units, onto a single plot. |Source=self-made |Date=February 27, 2008 |Author= P. Fraundorf |Permission=see |
File usage
The following pages on the English Wikipedia use this file (pages on other projects are not listed):
Global file usage
The following other wikis use this file:
- Usage on ar.wikipedia.org
- Usage on bg.wikipedia.org
- Usage on ca.wikipedia.org
- Usage on es.wikipedia.org
- Usage on pt.wikipedia.org
- Usage on uz.wikipedia.org
