


Get to Know the LabWare Key Performance Indicators (KPIs)

“On a Friday afternoon at 2:00 p.m., a sudden department meeting is scheduled within the hour to report the performance metrics of our labs. To do this, we’ll need information from our LabWare LIMS; how are we going to prepare for this meeting?”
The scenario above is a familiar situation we’ve seen and one that you may have encountered within your company. Although the configuration of key performance indicators (KPIs) is often a requirement included in the LIMS implementation, many LIMS implementation projects experience budget, time, and resources constraints; thus, the KPIs are often viewed as a nice to have that can be left out of the project.
No one wants to feel the panic when KPIs are needed and there’s no knowledge of how to pull them from LabWare LIMS. So, in this blog we’ll walk you through the types of KPIs available, their purpose, and some ideas for configuring and visualizing them in LabWare LIMS.
The Importance Of Configuring LabWare LIMS KPIs
When companies process a high volume of samples from multiple sources, with multiple types of testing requirements, and in multiple sites every day, they are a prime candidate for a LIMS. Let’s say they implement LabWare LIMS in their organization—they now have the means to pull metrics from the high volume of samples they are processing. These measurement metrics are the KPIs. KPIs are quantifiable measurements of a lab’s or a company’s operations that can provide the understanding to determine a company’s long-term strategic planning and insight into areas where additional focus or resources are needed.
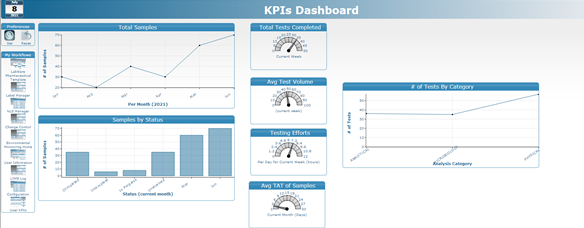
Some of these KPIs include:
- Total samples per month for the last six months
- Sample By Status for the current month
- Number of tests by category for the current week
- Total tests completed for the current week
- Average testing volume for the current week
- Testing efforts (hours) per day for the current week
- Average Turn Around time (TAT) for the samples completed for the current month
Common KPIs, like total samples per month for the last six months, are reviewed on a periodic basis (monthly, quarterly, yearly) for indication of growth in the lab’s operations. Evaluating a combination of KPIs, like total testing efforts, total tests completed for each type of test per day/week/month, and average TAT for sample completion, provides insight the company can use to make adjustments to move in the right direction for future growth. For example, if the total samples per month for the last six months is trending upward, the company may want to expand its lab personnel and/or capacity to accommodate this trend. If the testing efforts per day for the current week consistently exceed expected hours, this KPI could be an indication that testing is taking longer than expected. In this case the lab may want to review the staff’s proficiency with testing procedures, consider additional personnel training, or examine the instrument maintenance logs for possible instrument replacement.

Working With Experts To Track The Right LabWare LIMS KPIs
Companies that identify the need for a LabWare LIMS may not have the expertise in-house or the resources needed for this type of implementation; thus, there is a need for external resources to guide, plan, and execute the implementation. CSols Inc. has diverse resources and expertise to meet our clients’ project objectives, budget, and timeline.
The path from understanding the purpose of each KPI to the actual data retrieval to meet this need and build the right KPI may seem easy; however, the underlying LabWare data structure and relationships can be puzzling. Internal LIMS architecture is not easily understood and adds complexity to the formulation of the proper KPIs. In collaboration with our clients, CSols LabWare consultants provide the expertise to solve the puzzle and construct each KPI accurately for its purpose.
Configuring LabWare LIMS KPIs

During an implementation, one of the enhancements our consultants bring to a LabWare LIMS KPI configuration is data visualization in real time, within a visual workflow (VW) containing all the important KPIs. In LabWare, several visual representations are available: pie charts, line charts, bar charts, and even gauges can be used for data visualization. Pie charts, line charts, and bar charts are two-dimensional charts and the gauge is a one-dimensional representation.
For each KPI, the configuration is based on its purpose, parameters, and outcome and defined in detail within the documentation created by the Business Analyst. Some example uses for one-dimensional or two-dimensional charts are discussed below:
- Total samples per month for the last six months: this KPI needs a two-axis informational chart, and a two-dimensional chart is a good representation. A line chart was selected as the representation for this KPI. A bar chart can also be used.
- Average testing volume for the current week: this KPI has a fixed period, which can be represented with a single value. This is a good choice for the gauge representation because the gauge is small compared to the pie, line, or bar chart. Choosing this representation will save space on the VW so more information may be included. If space is not an issue, then any representation can be used.
“Five minutes before the meeting begins, our team logs into LabWare LIMS, opens the KPI Dashboard, and all the information needed is at our fingertips. We bring a laptop into the meeting and showcases the lab’s KPIs live!”
Because the KPIs are set up in LabWare LIMS Visual Workflows, the Lab Managers now can have direct access to the KPIs in the LIMS. This frees up the lab’s schedule from attending future reporting meetings and the Lab Managers are able to view the live performance metrics at any time.
Is this your story? If it isn’t, yet, you can achieve the same success!
KPI requirements may vary from one company to another, but the need behind this requirement is increasingly essential; no longer an afterthought. So, get to know your KPI needs and be sure to include them in your next LabWare LIMS implementation or project.
Contact us and let us show you how we can assist you in telling a successful LabWare LIMS KPI story.

