


Optimize Lab Efficiency Using LabWare KPI Dashboards
 Modern-day laboratories are experiencing record volumes of samples to process and test. Labs need to process these samples effectively and efficiently, but how is performance easily measured? Key Performance Indicators (KPIs) measure laboratory performance and help paint a picture of what is truly happening in the lab. KPIs can also provide insight into continuous improvement opportunities to increase laboratory productivity. LabWare LIMS KPI dashboards and reports offer quick, clear visibility into real-time performance metrics to drive results in your lab.
What is a KPI?
Key Performance Indicators (KPIs) are the critical indicators that show progress against an organization’s objectives and goals. They measure success and help drive informed business decisions.
If you can’t measure your metrics, you cannot monitor your progress against your goals. They need to be measured to obtain visibility and identify variances to control a process.
KPIs in the lab vary greatly depending on the industry or your lab type, but no matter the industry, KPIs provide direct insight into lab operations to ensure that the lab is running smoothly. Alternatively, routine monitoring of your KPIs can also quickly identify areas that need improvement. They can also highlight process improvement and training opportunities.
What makes a good KPI?
The five steps towards establishing vital KPIs can be defined under the SMART principles:
- Specific
- Measurable
- Achievable
- Relevant
- Time-based
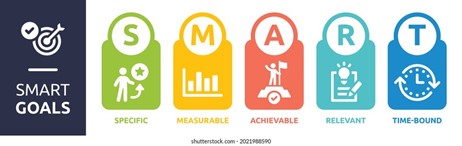
Define precisely what you want to achieve, when, and how success will be measured.
Why are KPIs important in the lab?
Setting vital KPIs can help you measure the impact of your efforts. When setting KPIs, it’s essential to define what you want to achieve, when, and how success will be measured. To ensure that your KPIs are effective, several vital questions need to be answered:
Firstly, is the KPI connected to the business goal? Business goals should act as a roadmap for all decisions made within the company. If your KPI does not tie directly into these goals, it may not impact the organization’s overall success. It is also essential to ensure that company leaders agree with the KPIs – this helps ensure everyone is working towards one unified set of objectives.
Secondly, the KPIs must be easy to define and understand. If stakeholders know what they’re meant to be measuring, it will be easier for them to contribute towards achieving these targets. It is also essential that these objectives can be quantified easily – if you’re unable to track progress, you won’t be able to assess how successfully you have achieved them.
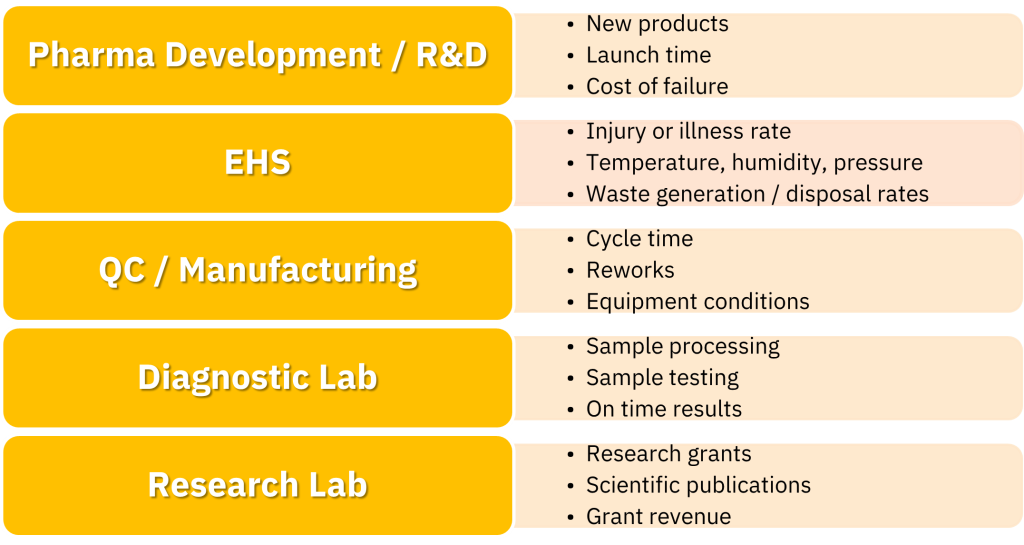
Finally, it’s crucial that your KPIs drive change. They should focus on outcomes rather than inputs – this means setting objectives related to measurable results, such as the number of new products launched on time for a Product Development lab or cycle time/number of reworks for a QC lab rather than activities like attending meetings or completion of tasks. This way, you’ll be able to track whether or not the changes made overall impact performance.
When setting KPIs, it is essential to ensure they meet specific criteria to have a meaningful impact on business goals and performance. Key points include ensuring they are aligned with the company’s business goals, being easily understandable and quantifiable, and driving change by focusing on outcomes rather than inputs.
KPIs also need to be communicated effectively within the organization for everyone involved in achieving them to be clear on expectations and able to work together towards achieving them. Establishing transparency around progress towards KPIs utilizing tools such as LabWare LIMS dashboards and reporting tools helps ensure that everybody is working towards similar objectives. Regularly discussing progress can also create a sense of accountability within the team and help keep everyone motivated. After all, if people don’t understand how their work contributes towards organizational goals, then it’s unlikely they will stay engaged with them long-term.
Common KPI Examples:
How many KPIs should you track?
Regarding tracking KPIs, “the critical few” is the best approach. This means picking two or three KPIs per goal – no more, no less – and constantly monitoring them over time. This allows you to quickly identify trends and plan accordingly while avoiding analysis paralysis or wasting valuable time on metrics that aren’t useful in the end.
“Not everything that counts can be counted, and not everything that can be counted counts.” – Albert Einstein
When choosing which KPIs to track, focus on those that provide meaningful insights rather than simply counting measures with no real context behind them. The goal should always be finding metrics that will tell you something new about your business rather than merely providing numbers without any real value added by measuring them in the first place.
Common mistakes in setting effective KPIs:
- Measuring too much
- Measuring the wrong thing or one type of metric
- Measuring the KPIs you’ve always measured
- Only measuring the easy things
- Ignoring or not using the data
- Averages may lie
What’s important to remember is that not all KPIs are created equal. Choosing ones that accurately reflect what you’re trying to measure and give you an accurate picture of your company’s performance is essential. To do this, start by brainstorming which goals need to be tracked and then map out how each KPI will help you meet them. Make sure each one has a clear purpose before settling on it for long-term monitoring.
How can LabWare LIMS improve KPI reporting?
The most common way of measuring KPIs is through dashboards and reports. Dashboard reporting allows managers to assess their team’s performance quickly, while detailed reports provide more in-depth analysis. Utilizing both sets of data helps managers make informed decisions about their organization’s future direction and strategies.
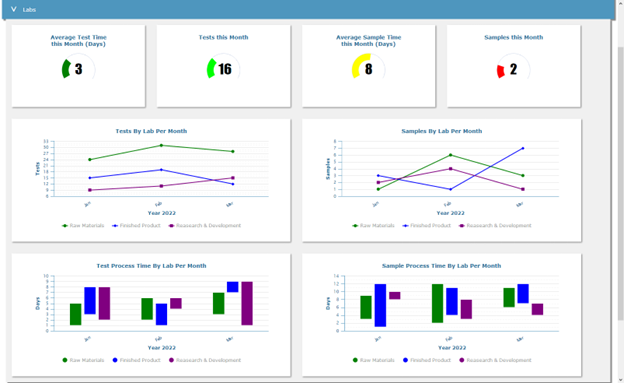
LabWare LIMS offers customizable dashboards that present data in an easy-to-understand format and allows users to monitor their KPIs in real time. The platform also includes advanced features such as Crystal reports which can be customized and scheduled for automatic generation and email notifications regarding KPI progress updates. On top of this, all of the necessary objects and tools for building visual workflows that link data to KPIs on demand are included with LabWare LIMS.
Below are LabWare LIMS visual workflow examples with customized KPI dashboards, which can be updated in real-time with the click of a button:
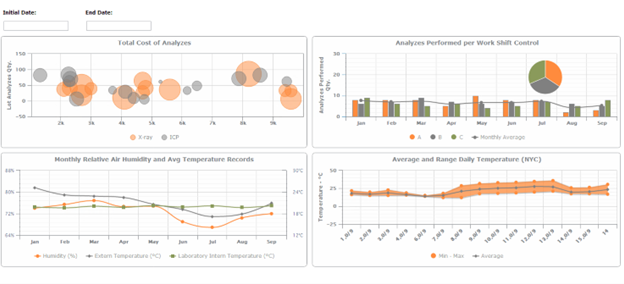
Visual KPI Workflow Templates developed by Astrix:
Summary
Having good KPIs and monitoring them regularly will help the lab keep running efficiently by providing the ability to track progress and make improvements quickly. It’s also important to remember that your goals change over time, and so should your KPIs. Review your goals and KPIs as the business needs change and update them accordingly.
LabWare LIMS KPI dashboards offer clear visibility into current performance so lab teams can quickly identify opportunities for improvement or take corrective action when necessary. These dashboards allow users to customize their data display to focus on the most essential metrics so they can quickly identify trends and bottlenecks in sample processing time. These real-time metrics allow labs to monitor their performance and adjust as needed based on what they learn from the data. These tools, when appropriately configured, guarantee greater accuracy in measuring performance—laying out clear steps for continuous improvement within any modern laboratory setting today!
Why It Matters to You
The benefits of using KPIs are many: they allow businesses to identify areas where they could improve their operations; establish benchmarks for measuring progress towards strategic objectives; identify new growth opportunities, and provide visibility into overall organizational performance.
In this blog, we discuss how:
- LabWare LIMS KPI dashboards can offer clear visibility into current performance, allowing lab teams to quickly identify opportunities for improvement or take corrective action when necessary.
- These dashboards allow users to customize their data display to focus on the most essential to identify trends and bottlenecks in sample processing time quickly.
- These real-time metrics allow labs to constantly monitor their performance and adjust as needed based on what they learn from the data.
About Astrix
Astrix is the unrivaled market leader in creating & delivering innovative strategies, solutions, and people to the life science community. Through world-class people, process, and technology, we work with clients to fundamentally improve business & scientific outcomes and the quality of life everywhere. Founded by scientists to solve the unique challenges of the life science community, Astrix offers a growing array of strategic, technical, and staffing services designed to deliver value to clients across their organizations. To learn the latest about how Astrix is transforming the way science-based businesses succeed today, visit www.astrixinc.com.

