


Using Standard Deviation to Dynamically Update LIMS Test Limits in QC Testing
Many laboratories compare analytical results to known limits to determine if results are within specification. These specification limits can be based on the standard deviation calculated from previous known results. As the standard deviation can change over time limits may need to be recalculated. The Matrix Gemini LIMS statistical process control chart function can automate this process to calculate and update the limits based on the relevant criteria.
Standard Deviation – Revision
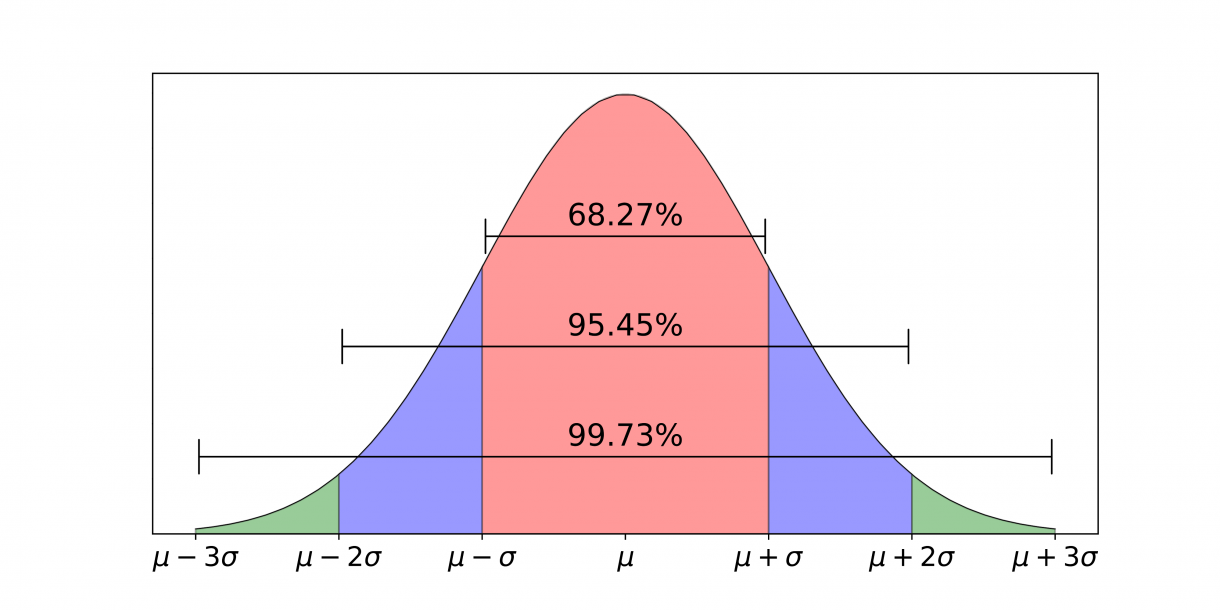
Scientists are taught early on to think about the variability and precision of results. This is often discussed mathematically in terms of a normal distribution around the average or mean, together with the standard deviation (σ, called sigma) of the values from the mean. In a normal distribution 68% of the values are within 1σ of the mean (μ), 95% within 2σ, and 99.7% within 3σ.
Using Standard Deviation in Laboratories
One way of using this information in laboratories is to define test limits or specifications based on the standard deviation. The information can also be used to define control limits such as the commonly used Westgard rules. Results that fall outside specifications limits can be flagged and indicate, for example, a problem with the quality of a manufactured product or a contamination issue with a water sample. Results that break control rules may indicate that an issue is developing with a manufacturing or analytical process.
Dynamically Setting Sigma Limits
Matrix Gemini LIMS can use the results of previous tests to calculate the standard deviation and associated values automatically.
First enough test results are gathered on a specific test to provide a meaningful spread of results. This allows an initial mean and standard deviation to be calculated and applied as limits to the test result for that test. Over time the laboratory builds up more data allowing them to refine these limits on a regular basis.
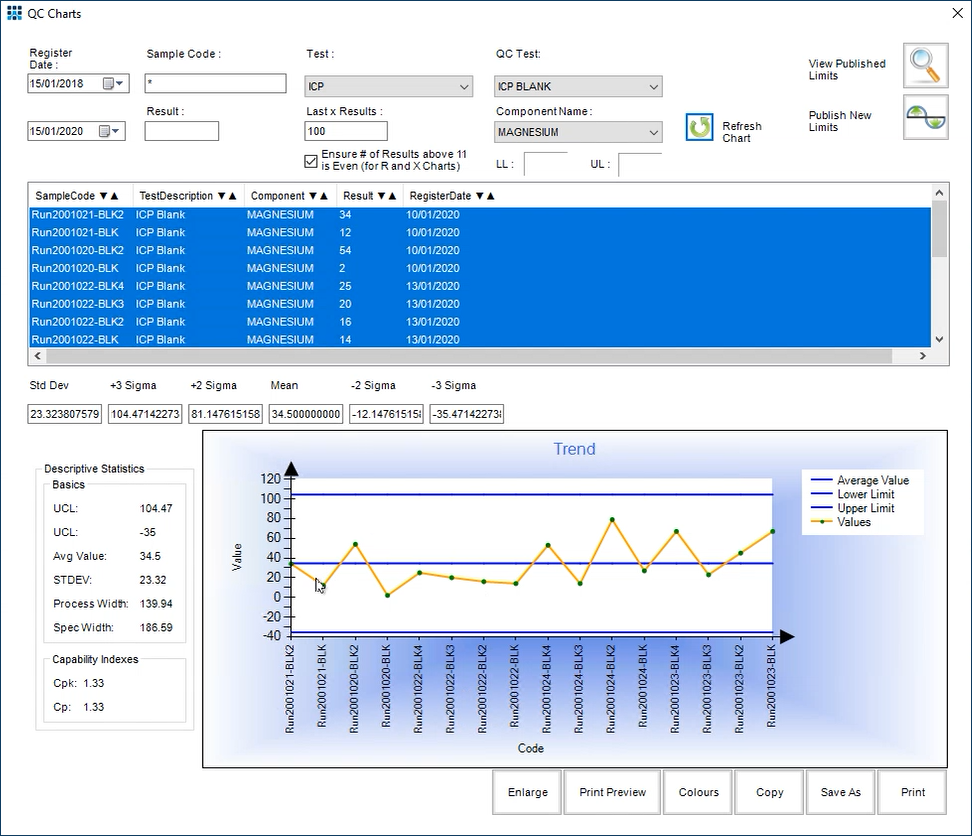
{SPC Chart Control showing showing recent test results for Magnesium}
The SPC chart above shows a (fictitious) example of the results of the magnesium test component in a heavy metals test. After running many samples through we get an average value (μ) of 34.5 with a standard deviation (σ) of 23.32. We can apply these limits to the magnesium test component for future tests by clicking the ‘Publish New Limits’ button.
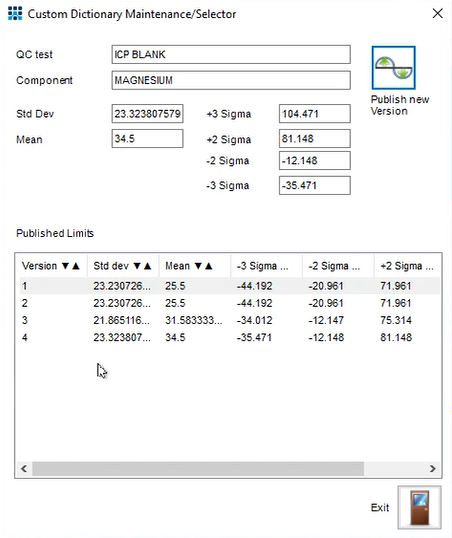
We can view these published limits, along with historical limits, by clicking the ‘View Published Limits’ button. The newest version (version 4 in the graphic) of the magnesium limits shows the new mean and standard deviation numbers, along with a historical record of previous limits for audit purposes. This screen highlights the change of numbers over time depending on the results obtained.
Looking at the test maintenance screen (below) we can see that the new 2σ and 3σ limits are now set against the magnesium test component. Future tests will use these new warning limits until the above process is repeated.
Using historical results to dynamically update test limits is a powerful feature to provide a warning of possible erroneous results and process drift in a quality control laboratory. This methodology can be used across manufacturing and environmental QC labs and is particularly prevalent in water QC laboratories.
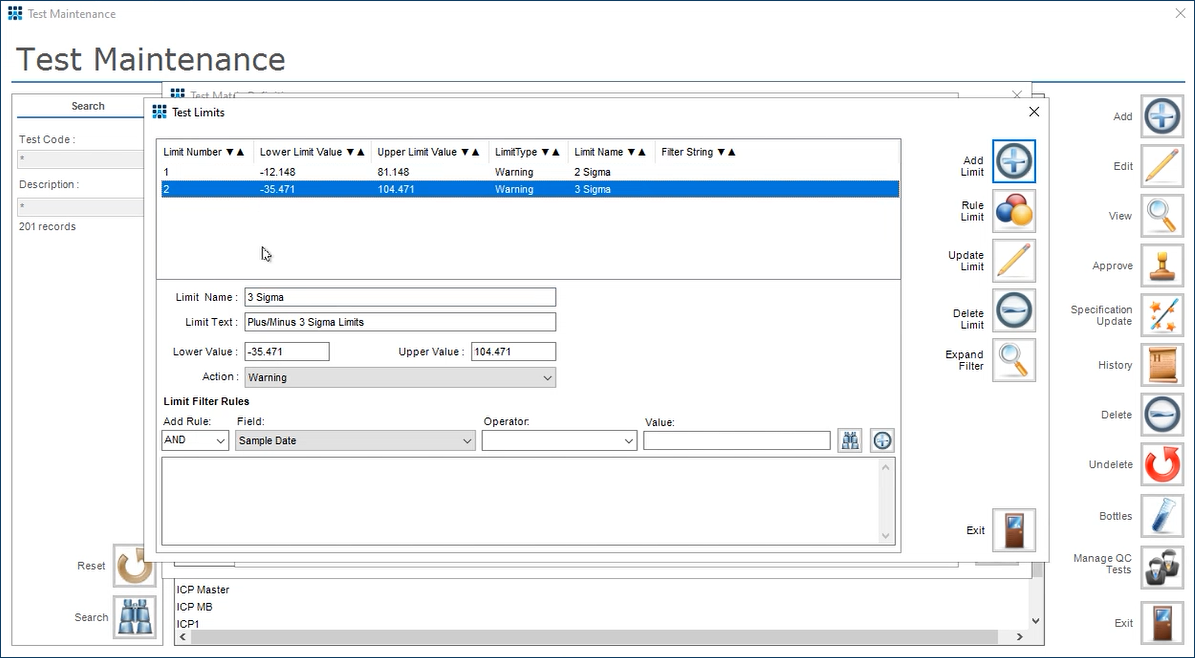
{Test Maintenance screen showing updated limits}
The final chart shows how the QC limit for the magnesium test component changes over time. In this case the graph shows that the last four analytical results have been compared to the recalculated (+3σ, +2σ, -2σ, -3σ) limits. Thus a complete record of the test limits being applied and the test results obtained is available for audit purposes.
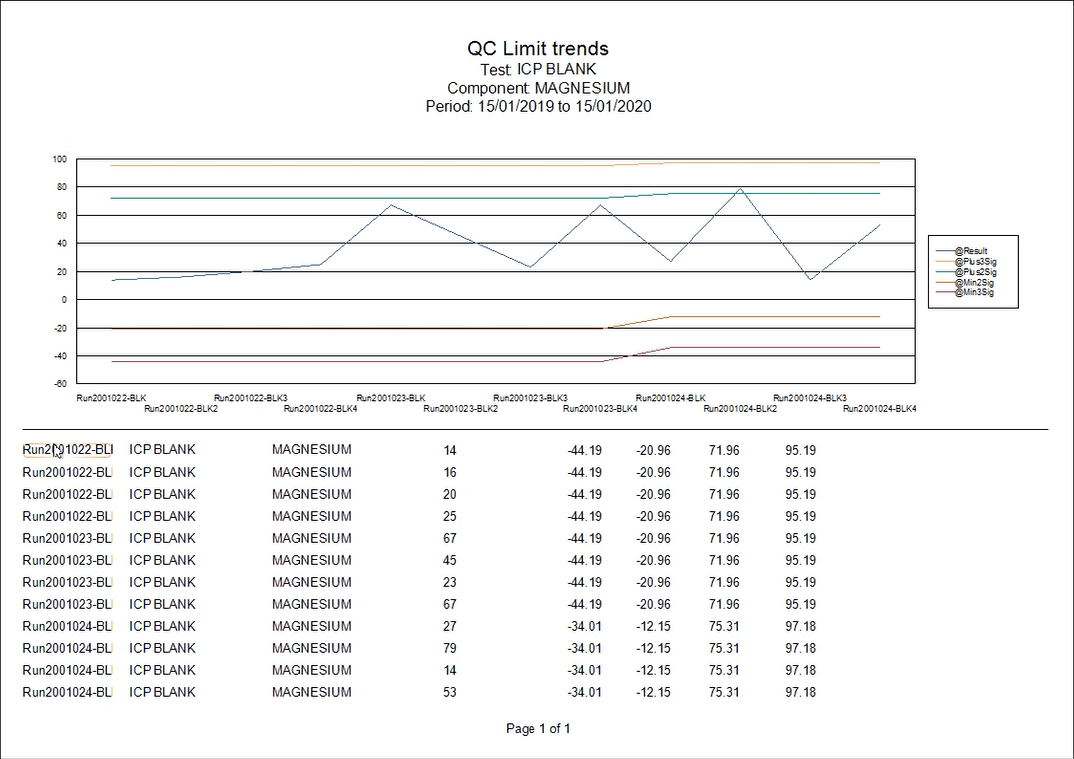
{Chart showing limits changing over time}
For further information on how to use this feature in Matrix Gemini LIMS and incorporate it into your testing regime please contact Autoscribe Informatics.

